JUSUNG ENGINEERING publishes accurate financial statements and results to ensure reasonable, transparent management and to make progress in maximizing shareholder value and corporate value.
(Unit : one hundred million won)
| Balance Sheet | 2018 | 2019 | 2020 | 2021 | 2022 |
|---|---|---|---|---|---|
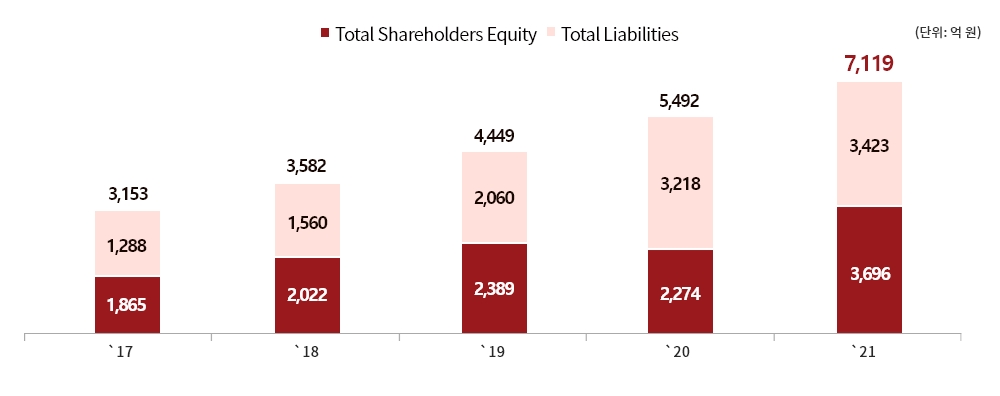
| Total Assets | 3,582 | 4,449 | 5,492 | 7,119 | 8,331 |
| Non-current Assets | 2,242 | 3,416 | 4,196 | 4,817 | 5,428 |
| Tangible Assets | 1,296 | 2,142 | 2,328 | 2,351 | 2,830 |
| Intangible Assets | 61 | 45 | 54 | 54 | 62 |
| Right-of-use Assets | - | 7 | 5 | 70 | 65 |
| Investment Property | 538 | 975 | 1,600 | 2,254 | 2,322 |
| Investment in Affiliated Businesses | 27 | 32 | 35 | 22 | 20 |
| Other Non-current Assets | 320 | 215 | 174 | 66 | 129 |
| Current Assets | 1,340 | 1,033 | 1,296 | 2,302 | 2,903 |
| Quick Assets | 509 | 510 | 742 | 1,715 | 1,911 |
| Inventories | 831 | 523 | 554 | 587 | 992 |
| Total Liabilities | 1,560 | 2,060 | 3,218 | 3,423 | 3,485 |
| Non-current Liabilities | 949 | 825 | 1,718 | 2,074 | 2,212 |
| Current Liabilities | 611 | 1,235 | 1,500 | 1,349 | 1,273 |
| Total Shareholders' Equity | 2,022 | 2,389 | 2,274 | 3,696 | 4,846 |
| Capital | 241 | 241 | 241 | 241 | 241 |
| Capital Surplus | 1,090 | 1,090 | 1,090 | 1,090 | 1,090 |
| Other Equity | - | - | - | - | (75) |
| Accumulated Other Comprehensive Income | 89 | 237 | 232 | 216 | 477 |
| Earned Surplus | 602 | 821 | 711 | 2,149 | 3,113 |
| Equity Attributable to Patent Owners | 2,022 | 2,389 | 2,274 | 3,696 | 4,846 |
| Non-controlling Interest | - | - | - | - | - |
| Total Liabilities and Stockholders' Equity | 3,582 | 4,449 | 5,492 | 7,119 | 8,331 |
(Unit: One hundred million won)
| Income Statement | 2018 | 2019 | 2020 | 2021 | 2022 |
|---|---|---|---|---|---|
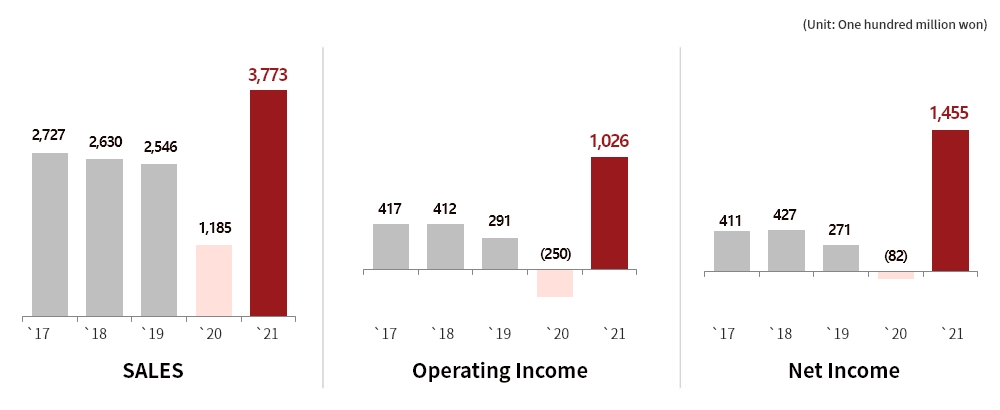
| Revenues | 2,546 | 1,185 | 3,773 | 4,379 | 4,379 |
| Costs of Sales | 1,469 | 671 | 1,836 | 1,903 | 1,903 |
| Gross Profit (loss) | 1,077 | 514 | 1,937 | 2,476 | 2,476 |
| Selling and Administrative Expenses | 786 | 764 | 911 | 1,237 | 1,237 |
| Operating Income (loss) | 412 | 291 | (250) | 1,239 | 1,239 |
| Other Non-Operating Income (cost) | 19 | 250 | 771 | 139 | 139 |
| Finance Income (cost) | (9) | (45) | (56) | (27) | (27) |
| Gains and losses on investments in associates | 5 | 4 | 1 | - | - |
| Profit Before Income Tax | 306 | (41) | 1,742 | 1,351 | 1,351 |
| Income Tax Expense | 35 | 41 | 287 | 289 | 289 |
| Net Income (loss) | 271 | (82) | 1,455 | 1,062 | 1,062 |
Cash Flow Statement (Unit : one hundred million won)
| Cash Flow Statement | 2018 | 2019 | 2020 | 2021 | 2022 |
|---|---|---|---|---|---|
| Cash Flow from Operating Activities | (349) | 573 | 16 | 1,107 | 1,010 |
| Cash Flow from Investment Activities | (491) | (934) | (846) | 69 | (484) |
| Cash Inflow from Investment Activities | 8 | 16 | 121 | 323 | 3 |
| Cash Outflow from Investment Activities | (499) | (949) | (967) | (254) | (487) |
| Cash Flow from Financial Activities | 455 | 393 | 876 | (180) | (484) |
| Cash Inflow from Financial Activities | 605 | 696 | 1,680 | 620 | - |
| Cash Outflow from Financial Activities | (150) | (303) | (804) | (800) | (484) |
| Increase(decrease) in cash before effect of exchange rate changes | (386) | 32 | 46 | 996 | 42 |
| Cash at the Beginning of the Year | 492 | 106 | 137 | 185 | 1,192 |
| Effect of exchange rate changes on cash equivalents | - | (1) | 2 | 11 | (24) |
| Cash at the End of the Year | 106 | 137 | 185 | 1,192 | 1,210 |